|
CMSIS-View
Record program events, display status information, and analyze execution faults
|

|
|
CMSIS-View
Record program events, display status information, and analyze execution faults
|
|
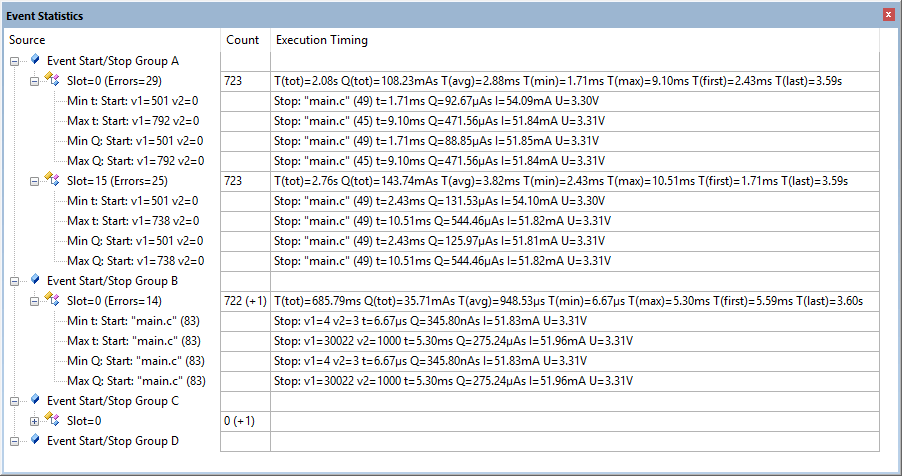
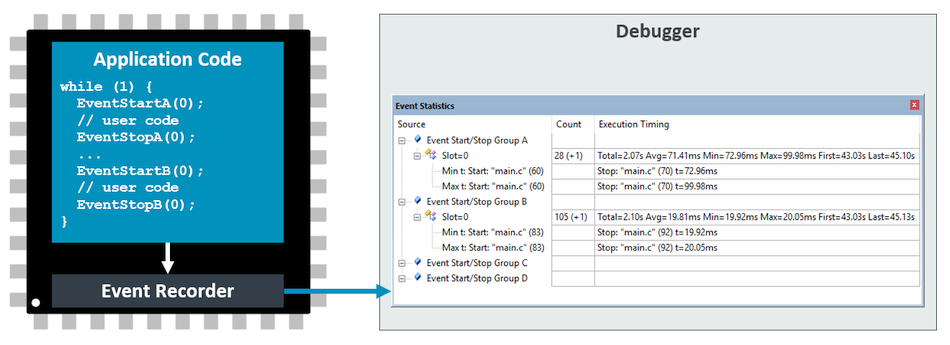
The Event Execution Statistics functions allow you to collect and statistical data about the code execution. Any debug adapter can be used to record execution timing and number of calls for annotated code sections:
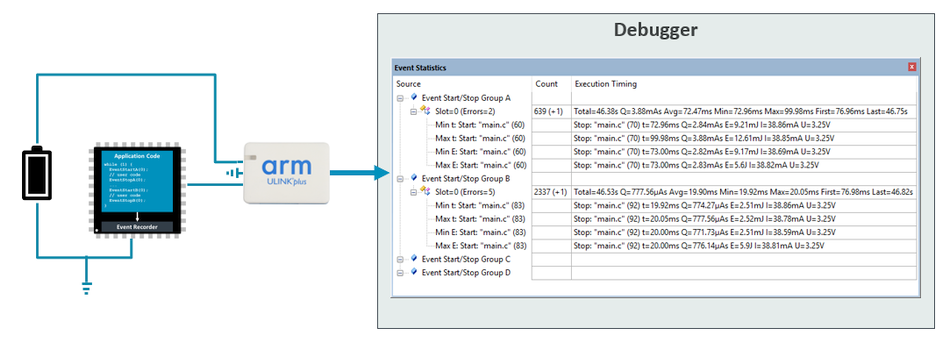
Energy profiling is of annotated code sections is possible using ULINKplus. When combined with power measurement, the Event Statistics window displays the energy consumption of the code section with min/man/average values:
For more information, refer to the EventStatistic example.
Benefits of Event Statistics:
Using a ULINKplus debug adapter, you can also record and analyze the energy that has been consumed in each execution slot. Using the above example on a hardware target with a ULINKplus, you get the following display in the Event Statistics window of µVision (the Event Recorder window does not change):